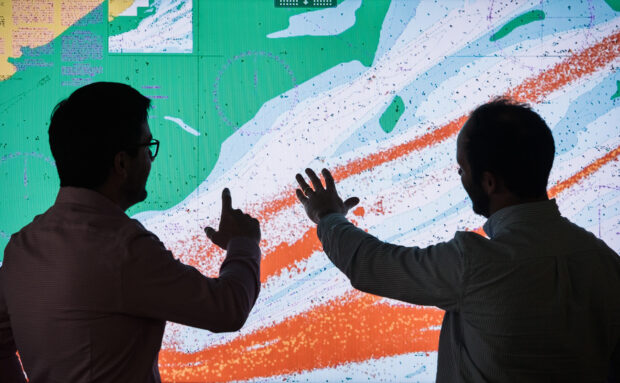
We collect, collate and publish lots of marine geospatial information at the UK Hydrographic Office. We are always looking for new ways to improve the way we process this information to help us create a better understanding of our oceans and how they’re used.
One of the ‘big data sets’ that has provided us with real value is data from Automatic Identification Systems, or ‘AIS’. To help us gain even more valuable insight, we’ve done some work to improve how we process the vast amount of AIS data we hold.
What is AIS?
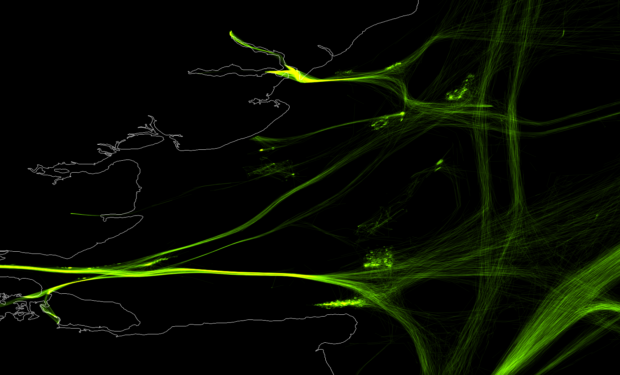
In shipping, AIS is designed as a peer-to-peer system where all vessels broadcast their position, speed and direction, along with identifying information about the ship, to improve visibility.
Although AIS was designed for collision prevention, it can also be received by satellites and terrestrial stations, where it can be stored, collated and transformed into a data source that can be analysed for other purposes.
Within our portfolio of ADMIRALTY Maritime Data Solutions, we offer over 15,750 Electronic Navigational Charts (ENC) to help mariners navigate safely at sea; so for us, AIS offers valuable insight which can help us to improve our products and efficiency in ways that was never possible before.
Our ENCs, for example, show mariners where to anchor when transiting to a particular port; with AIS data, we can understand how many ships are using these anchorages and whether there are any developments of new anchorage areas.
It is fascinating to see how the data and products we create affect navigation decisions. And the more we use AIS data, the more applications we have found – from tracking the use of our products, to verifying the accuracy of new navigational information.
How we used to process AIS data
Previously, we used to store all our AIS data in a massive relational database, with indexes on commonly-used fields to speed up frequently run queries.
This meant that for each year’s worth of data, we stored around 4.5 billion records. For a traditional relational database this is large, but when also combined with spatially complicated queries - we found the database wasn’t performing well enough for us.
It would take us up to 2 weeks to analyse vessel traffic over all of our navigational products. We knew we could do better.
Improving our system
Our Research, Innovation and Integration team worked with our Data Science team to investigate the options for improving the way we process this AIS data. We planned to do this using the orginisation's new data platform being developed as part of our Marine Information Transformation Programme (MInT).
Initially we knew we wanted to use Spark and Scala to help us process this data across the platform's Hadoop cluster, but were not sure of the best way to analyse the spatial features of our data. Spark and Scala have built in capability for basic data types, but for data that is spatially enabled like AIS you need to something to extend this capability.
After appraising a multitude of projects, we chose to use Java Topology Suite to achieve this as we were already familiar with its capabilities. It also seemed like the most simple approach. This is partly because the spatial information in AIS data can be held as latitude and longitude pairs, therefore we didn’t need all the geospatial capabilities offered by the other ‘big geo’ packages.
So… was it worth it?
Our new process compares 4.5 billion AIS records against our 15,750 ENCs in under 60 minutes. Using our old process, it would take over a week to do the same calculation – it now takes 0.6% of this time to complete.
Final thoughts
AIS data helps us track trends within our products and is the very first step in understanding exactly how they are being used.
We think the time and effort invested in the research, development and implementation was well worth it. Using the new process, we can analyse global vessel traffic for an entire year in under an hour!
For us, this investment gives us the capability to run further analytics and process more complex data in the future, so that we can keep improving our products for our customers in smarter, data-driven ways.