In January 2026, the Blue Belt Programme embarked on its first expedition across the Caribbean, charting the previously unexplored waters of Anguilla, the Turks and Caicos Islands and the Cayman Islands.
A team of 46 marine scientists spent six weeks aboard the RSS James Cook. Local marine scientists from each of the Caribbean nations were joined by UK scientists from the British Antarctic Survey, National Oceanography Centre, the Natural History Museum and the UK Hydrographic Office (UKHO).
Through the course of the expedition, the team mapped over 25,000km² of seafloor. The seabed mapping data collected will provide the local areas with further understanding of their marine environment, supporting a range of applications such as the safe navigation of vessels, habitat conservation and biodiversity and coastal management.
Ahead of World Hydrography Day, we caught up with Rosa Crespo Sanchidrián (RSC) and Matthew Bennett (MB), Senior Hydrographic Specialists, who represented the UKHO on board the vessel, to find out more and hear about the UKHO’s role, their experiences in the field, and some of the expedition’s most exciting discoveries.
Can you provide an overview of the UKHO’s role in the Beyond the Reef expedition?
RSC: As a world-leading centre for hydrography, the UKHO was primarily tasked with conducting bathymetric surveys to measure and map the depth and characteristics of the seabed. Throughout the expedition, these insights had a range of applications, from supporting research into biodiversity to ensuring safety of navigation.
Seabed mapping was especially vital to this expedition as many existing nautical charts of the region rely on data that was collected over 100 years ago. These historical measurements were made using lead line surveys which are less precise than those made by modern hydrographic surveying equipment. Conducting new surveys gave us the opportunity to greatly improve our understanding of the underwater environment.
Could you provide an insight into how different hydrographic surveying techniques were used during the expedition?
RSC: We mainly used sonar to measure water depths. This works by emitting pulses of sound from beneath the ship and measuring the time it takes for the pulses to bounce off the seafloor and return. Sound travels at a known speed through water so we can use that travel time to calculate precise water depths.
The instruments we used were multibeam echosounders, which send out around 1,500 soundings per second, enabling us to survey wide swathes of the seafloor in a single pass. This meant we were able to build up a detailed picture of vast areas of seafloor in a relatively short time.
MB: We also used our sonar equipment to record backscatter, which helps us to identify the composition and texture of the seafloor. These work by measuring the intensity of sound reflected off the seafloor - different seafloor types reflect sound differently, allowing us to identify their characteristics. Hard bottoms such as coral or rock produce a strong return signal, while softer materials like sand absorb more sound and return a weaker signal.
To verify what the sonar data was telling us, we also deployed drop cameras. These are camera systems which are lowered on a cable directly to the seafloor to visually survey the habitats below. This process, known as "ground truthing," allows us to confirm what the acoustic data suggests. In practice, the cameras confirmed that much of the seafloor we surveyed was sand!
Why are hydrography and seabed mapping so important for environmental conservation?
RSC: Bathymetry and hydrodynamics play an important role in fish distribution. You tend to find a lot more life when the depth drops off as it is just too hot in shallower waters. Once we reached the submerged boundary of a continent, known as the continental shelf, the sea floor got deeper, and we saw lots more fish and even humpback whales.
We used sonar and water column data to identify species, assess biological abundance and characterise habitats. Rocky areas have significant amounts of life compared to sandy seabeds as the variation creates habitats for fish, plants and invertebrates as well as providing shelter from predators.
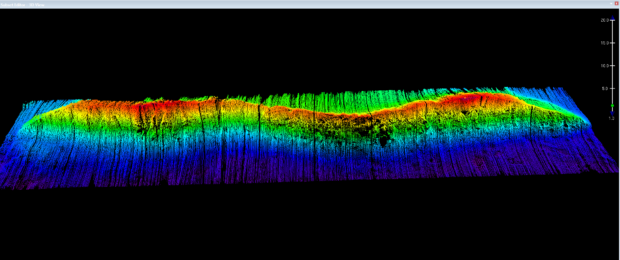
MB: The team was especially excited to find sea mounts and ridges. These are ecological hot spots drawing together all the different marine communities. Even as someone less familiar with the biology side of things, the imagery was beautiful to see.
We didn’t know what we would discover, so this led to some significant surprises. At one point, we discovered a new mesophotic reef that hadn't been reported before on Malliwana Bank in Anguilla.
From a hydrographic perspective, what were some of the most interesting or surprising discoveries that you made during the expedition?
MB: Turks and Caicos was unlike any seabed I’ve surveyed before. There were seamounts, ridges and, immense vertical drop offs going from 40m to 1000m depth in seconds.
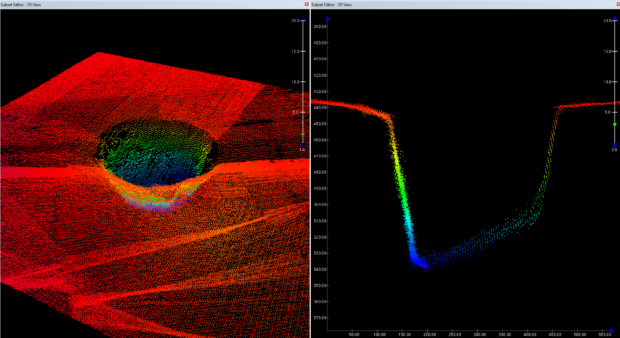
In the south of Grand Turk, we found an underwater sinkhole, or ‘blue hole,’ which was 300m wide and 100m deep. This is probably the biggest in the entire Caribbean region and has never been charted before. We found this completely by chance as we had initially planned to survey the north of the island but moved to the more sheltered south to avoid bad weather. It was very flat which was strange for this area. The first ship track line just looked like lots of messy data, so we didn’t think anything of it. The second line of the same area gave a perfect circular shape.
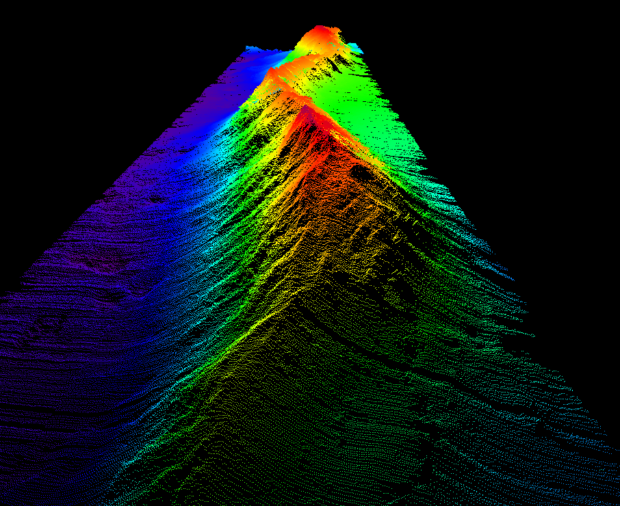
RCS: We also found a major ridge to the Nort East of Turks and Caicos. Data used for planning showed lots of separate seamounts, but it turned out to be a huge continuous ridge: 70km long and almost four thousand metres high.
It was exciting to realise the impact this will have on biodiversity on both sides of the ridge. The steep slopes of the ridge force nutrient-rich deep waters to rise toward the surface. This process, known as upwelling, generates food for a remarkable variety of fish and other marine fauna.
The deepest point we surveyed was in Anguilla at 6,200m. To put that in perspective, this is almost 1000m higher than Everest base camp, but underneath us. It was impressive to be over the reef and see the depths yourself. It would be perfect turquoise Caribbean water, a line where the ridge was, and suddenly the water would be dark blue.
Could you provide some examples of how the data collected will be used in the future by governments of various countries?
RCS: Our bathymetric surveys have created a foundational dataset which has been shared with the local governments and other regional maritime stakeholders.
The Centre for Environment, Fisheries and Aquaculture Science (Cefas) will use it as the basis to designate marine protected areas which help protect sensitive ecosystems from human activity. Beyond conservation, regional governments and port authorities can draw on the data in all sorts of ways. Anguilla, for example, are planning to build a marina and our seabed maps will be used to help ensure vessels can safely navigate into and around the new facility.
That’s really what we mean when we refer to bathymetry as a foundational dataset: something that can be built on in whichever direction is most needed, whether that’s conservation, infrastructure, fisheries management, or safety. It lays the groundwork and others can take it from there.
How was your experience working with other marine research groups? Why is this collaboration between marine science disciplines so important?
MB: It was interesting to see other organisations’ activities and how all our work was intertwined. For example, our bathymetry data and backscatter would help identify where tow cameras could be dropped and how deep mid-water trawl nets could be deployed to sample fish populations.
RCS: This was a great opportunity for all the participating organisations. As scientists, the experience of going offshore and conducting surveys in the field helps us keep our skills up to date. I was initially nervous but was made to feel welcome. All the different teams were happy to share knowledge. We ended up training and supporting each other throughout the expedition.
What would you say was your personal highlight of the expedition?
MB: There were so many highlights, I’ve never surveyed such an interesting seabed before. There was an incredible variety of features down there such as seamounts and ridges. The best point was discovering the blue hole. It had been quite an uneventful shift up until that point!
RSC: For me it was the fish. Of course, I knew there would be fish but none of the varieties we were finding. It was interesting to work with the fisheries: we would get fish from 1000m and then sort and analyse them. It was amazing to see them under the Ultraviolet (UV) light.
I found the fisheries acoustics particularly interesting. Acoustics are a core part of our work, it was fascinating to see them applied in other ways: the team used them to pinpoint where fish were located, estimate population sizes, and even identify species.
I also really enjoyed working with the people on the expedition. It was quite an intense trip working twelve hours a day, but everyone was so welcoming. It was a very collaborative atmosphere and I learnt so much.
Find out more about the Beyond the Reef Expedition on the Blue Belt Programme blog.
Leave a comment